TABLE OF
I. Introduction
B. Purpose
B. Area Business and Resident Survey
D. Lawrence Planning Commission Update
III. Ultimate Land Use for Watershed
B. City Input
IV. Data Collection
B. Surveys
V. Internal Drainage System Analysis
B. Findings and Recommendations
1. System 1
2. System 2
3. System 3
4. System 4
5. System 5
6. System 6
7. System 7
8. System 8
9. System 9
10. System 10
11. System 11
12. System 12
D. Hydrologic and Hydraulic Analyses
A. Overview
1. General Project Information
2. Data and Model Development
3. Input Parameter Development
4. Naming
5. Hydrologic Methodology
6. Model
1. General Project Information
2. Data Sources
3. Input Parameter Development
4. Results
E. Alternatives for Future Development
1. Flood Reduction Alternatives
2. Future Hydraulic Drainage Improvements
3. Summary
VII. Kansas River Floodplain Analysis
A. Purpose
B. Results
1. General Project Information
2. Data Sources
3. Input Parameter Development
EXE
I. Introduction
The
The
North Lawrence Drainage Study was divided into two main focus areas. The
Internal System consists of the
II. Recommendations
A. Overall Watershed
Several alternatives were investigated in the overall North Lawrence Drainage Study watershed to reduce flood elevations, lessen impacts on the “Internal Drainage System” facilities, provide drainage in the event of high flows on the Kansas River, and assess the effects of development in the floodplain. The investigations led to the four major recommendations below. The first bullet item is the key to reducing the burden on the Internal System from areas beyond the existing city limits.
- Drainage from north of 24/40 Highway should be cutoff by the highway embankment and the water should be pumped over the levee at a point just east of the 24/40 intersection to reduce the burden on the 2nd Street Pump Station
- Future development in the watershed should maintain the current conveyance levels in the 100-year floodplain – development should not reduce the capacity for floodplain storage
- The
- Major roads and hydraulic structures should be improved to meet the current APWA criteria with regard to overtopping during the 100-year event, in order to provide adequate emergency services to the area
A cost summary with regard to these Watershed Analysis recommendations is shown in the table on the next page.

B. Internal System
Analyses
for the Internal Drainage System provided areas of concern throughout the
|
Prioritization of Internal Systems |
||
|
Link Name |
Excess Peak Flow |
Total Estimated |
|
(cfs) |
(dollars) |
|
|
S1-1 |
315 |
$9,163,000 |
|
S6-1 |
168 |
$3,994,000 |
|
S9-1 |
133 |
$1,132,000 |
|
S1L1-1 |
96 |
$333,000 |
|
S1L5-1 |
85 |
$235,000 |
|
S1L7-1 |
85 |
$59,000 |
|
S1L3-1 |
56 |
$187,000 |
|
S6L3-1 |
56 |
$195,000 |
|
S6L3-7D |
New pipes |
$181,000 |
|
S4-1 |
43 |
$60,000 |
|
S6L2-1 |
37 |
$5,000 |
|
S4L4-1 |
35 |
$53,000 |
|
S4L2-1 |
27 |
$36,000 |
|
S9L1-1 |
21 |
$7,000 |
|
S1L2-1 |
20 |
$240,000 |
|
S8-1 |
17 |
$115,000 |
|
S10L2-1 |
13 |
$4,000 |
|
S7-1 |
13 |
$38,000 |
|
S5-1 |
10 |
$56,000 |
|
S10-1 |
6 |
$106,000 |
|
S1L4-1 |
1 |
$7,000 |
|
S1L6-1 |
0 |
$0 |
|
S11-1 |
0 |
$0 |
|
S3-1 |
0 |
$0 |
|
S2-1 |
0 |
$0 |
|
S12-1 |
0 |
$0 |
|
Total |
|
$16,206,000 |
The flows calculated in the analysis of the internal system assume that the cutoff north of 24/40 Highway, as recommended by the Watershed Analysis, is in place. However, the costs in the table for the Internal System Analysis are independent of the costs for the Watershed Analysis improvement recommendations. By adding the total costs from each of the two summary tables, the estimated cost of all recommendations is approximately $41 million.
As with the overall watershed, a viable option within the internal system is land purchase. In areas that naturally drain to a low point, it is often advantageous to preserve the ponding area by purchasing the parcel of land. Those costs are included in several of the system costs in the table.
III. Background
A. Watershed Description
The
North Lawrence watershed is estimated to be 9,100 acres generally bordered by
the Kansas River levee on the south and the Mud
The Kansas River floodplain completely encompasses North Lawrence. The natural silt loam soils are highly permeable. However, increased development is replacing those soils with nearly impermeable clay material in certain areas. In addition, extremely mild slopes across the landform cause frequent ponding and roadway overtopping. Historically, North Lawrence has been an agricultural community with low density residential development. Pockets of commercial and industrial development now appear in areas of the watershed. While parts of North Lawrence will likely remain agricultural, the projected future land use in other areas will add more and more impervious surfaces.
B. Purpose
The
Lawrence-Douglas
- Development that has significantly increased runoff from design storm events
- Undersized drainage system components such as culverts, drainage channels, underground pipe systems and inlets
- Siltation within the storm drainage system
- Past development of flood-prone areas
- A shallow, flat and interrupted watershed drainage network
Public comments relating to current drainage issues, proposed developments, long-range plans, and floodplain regulations are at the root of this study. The purpose of this study is to identify areas with flooding problems, analyze the major elements of the storm drainage system with respect to long-term land use, and recommend needed improvements to correct or prevent systems from flooding. By doing this, proposed developments and long-range plans will be influenced. At the same time, regulations can be conceptualized to avoid potential pitfalls.
The North Lawrence Drainage Study has several major components which work toward the generation of system requirements for stormwater conveyance and infrastructure in the ultimate buildout scenario. The following major tasks were included in the study:
- Integration of the public involvement program that gathered and used information from residents, business owners and property owners when considering alternatives or upgrades within the watershed
- Estimation of the ultimate land use for the watershed
- Survey and general inspection of the drainage system
- Development of a digital database that shows the
existing components of the
- Evaluation of the internal drainage system for the ultimate buildout scenario and recommendation of improvements
- Evaluation of the watershed drainage system for the ultimate buildout scenario and recommendation of improvements
Along with the recommended improvements, the magnitude of the costs required to implement them were assessed. It should be noted though, that detailed design of the projects recommended in this report is required to produce proper construction documents and accurate cost estimates for system components.
The main body of the project report is divided up into seven sections. Summaries of the various sections are detailed below. For a detailed description of the methods or results of each section, refer to the main report.
IV. Public Involvement
The
North Lawrence Drainage Study public involvement program was designed to
establish meaningful and useful dialogue between stakeholders, businesses,
residents in the area and the study team. A series of outreach efforts
were conducted to catalogue and assess the public’s concerns. Members of
the project team provided an overview of study activities and public input to
the Lawrence Planning
V. Ultimate Land Use for Watershed
To accomplish the goals of the North Lawrence Drainage Study, the ultimate land use condition had to be determined for the study area. The future land uses within the watershed will help determine where to focus the stormwater system improvements and provide better insight into heading off potential development problems. The project team conferred with the Public Works Department, the Planning Office, and the Utilities Department of Lawrence. Information was gathered with regard to current zoning, potential developments and long-range plans and was used to produce an ultimate watershed land use guide.
While the information gathered was used to create the Ultimate Build-Out map, it was not intended to dictate specific policies with regard to land use in the North Lawrence Drainage Area. However, certain policies could be inferred from the findings of this study. For instance, lot splits currently require a hydraulic study to determine impacts. Due to the extensive hydraulic studies detailed in this report, it would not be necessary for developers to conduct individual studies, as long as the general recommendations of this study are followed (i.e. conveyance needs to be maintained within the floodplain).
VI. Data
Several
field visits were made to the study area to observe drainage patterns, take
photographs and verify structure sizes and orientations. A significant
portion of the North Lawrence watershed was surveyed for this project.
This information was used in the development of computer models of the
watershed. Information from the field survey forms was entered into
GIS. The basis for the evaluation of the North Lawrence watershed is the
digital base maps developed by the
VII. Internal Drainage System Analysis
The
system of
Results of the hydrologic and hydraulic analyses for the set of 12 systems representing the existing stormwater infrastructure within North Lawrence identified many surcharge locations for the ultimate buildout condition.
Recommendations were determined for each conduit or channel in a system based on the analysis of the entire system. It should be noted that improvements are to generally be made in a downstream to upstream manner within the system, as there is no advantage trying to deliver more flow to a downstream component that cannot convey the existing flow. Overall costs for each system upgrade were estimated; however, for the purposes of prioritizing public improvements on a smaller scale, excess peak flow was determined for each main stem and each lateral draining to the main stem of the system.
VIII. Watershed Analysis
There
were three main goals for this portion of the study: to reduce the demand
on the 2nd Street Pump Station, to expel floodwater from the basin
during times of high water on the Kansas River, and to investigate the effects
of development in the floodplain. It is recommended that the drainage
from the area north of 24/40 Highway be cut off and the water pumped over the
levee. The recommendation for reducing the burden on the
The recommendation for future development in the watershed is to maintain the current conveyance levels in the 100-year floodplain. This will mean allowing no development in these areas that would reduce the capacity for floodplain storage, and may require the purchase of small parcels of land to set aside exclusively for ponding.
As the area develops, it will become necessary to provide emergency services to the homes and businesses that populate the area. This will require the improvement of the major roads in the area and significant improvement of the hydraulic structures which carry flow under the roads. With a more dense urban population, the roads should be raised to meet the current APWA criteria with regard to overtopping during the 100-year event. This will result in some significant increases in required flow capacity over the existing hydraulic structures.
IX. Kansas River Floodplain Analysis
The existing conditions FEMA hydraulic model was revised to assess the amount of flooding that would occur in the North Lawrence area in the event of a breach of the Kansas River levee system. A “most likely” breach location was determined for the purpose of this analysis. For the levee breech condition, a 100-year Kansas River event would result in flood levels 0 to 7 feet deep in the North Lawrence Watershed (refer to the exhibit titled Watershed Analysis – Kansas River Inundation in Section VII).
The
The
North Lawrence watershed is estimated to be 9,100 acres generally bordered by
the Kansas River levee on the west and south and the Mud
The Kansas River floodplain completely encompasses North Lawrence. The natural silt loam soils are highly permeable. However, increased development is replacing those soils with nearly impermeable clay material in certain areas. Extremely mild slopes across the landform cause frequent ponding and roadway overtopping. Historically, North Lawrence has been an agricultural community with low density residential development. Pockets of commercial and industrial development now appear in areas of the watershed. While parts of North Lawrence will likely remain agricultural, the projected future land use in other areas will add more and more impervious surfaces.
D. Purpose
The
Lawrence-Douglas
- Development that has significantly increased runoff from design storm events
- Undersized drainage system components such as culverts, drainage channels, underground pipe systems and inlets
- Siltation within the storm drainage system
- Past development of flood-prone areas
- A shallow, flat and interrupted watershed drainage network
Public comments relating to current drainage issues, proposed developments, long-range plans, and floodplain regulations are at the root of this study. The purpose of this study is to identify areas with flooding problems, analyze the major elements of the storm drainage system with respect to long-term land use, and recommend needed improvements to correct or prevent systems from flooding. By doing this, proposed developments and long-range plans will be influenced. At the same time, regulations can be conceptualized to avoid potential pitfalls.
E. Scope of Project
The North Lawrence Drainage Study has several major components. They all worked toward producing requirements of the system of stormwater conveyance and infrastructure in an ultimate build-out scenario. The first step in doing this was obtaining accurate, reliable data about the watershed. This included past and current drainage issues and technical information on the conveyance systems themselves. Next, there had to be an understanding of what the build-out scenario will be and how to appropriately apply it to the analyses. Three distinct analyses were then performed to produce recommendations for alleviating potential problems within the watershed. The following major tasks were included in the study:
- Integration of a public involvement program that gathered and used information from residents, business owners, and property owners when considering alternatives or upgrades within the watershed
- Estimation of the ultimate land use for the watershed
- Surveying and general inspection of the drainage system
- Development of a digital database that shows the
existing components of the
- Evaluation of the internal drainage system for the ultimate build-out scenario and recommendation of improvements
- Evaluation of the watershed drainage system for the ultimate build-out scenario and recommendation of improvements
Recommended improvements help to determine the magnitude of the costs required to implement the needed stormwater system upgrade. It should be noted, though, that detailed design beyond the master planning level is required to accurately produce cost estimates for system components.
Link to diagram: North Lawrence Watershed
Section II: Public Involvement
The North Lawrence Drainage Study public involvement program was designed to establish meaningful and useful dialogue between area stakeholders, businesses and residents in the area and the study team. A series of outreach efforts were conducted; summaries of those efforts follow.
A. Key Stakeholder Interviews:
During
May and June, 2004, members of the team conducted stakeholder interviews to
evaluate community leaders’ perceptions and opinions about the area, drainage
needs and stormwater management in
The interview questions and responses are detailed below. Key themes included the need to efficiently address the problem in terms of infrastructure needs and costs, and to balance future development with current land use patterns.
What are your biggest
concerns/problems related to stormwater management in
- Area is notorious for flooding
- Better than it used to be; impression that work has already been done
- Pump station seems to help
- Disposal of stormwater – getting it to the river
- Dealing with areas not served by the pump station
- Getting the water into the river
- Several low-lying areas are frequently under
water, including
What do you see as the
biggest challenge to improving stormwater management in
- Topography
- Levee
- Money
- Area between river and tracks is higher than area north of tracks; difficult to move water from north of tracks to river
What types of stormwater management changes or improvements do you think would best serve the area?
· Stormwater removal is main concern
· Because of industry and planned development, stormwater treatment may be necessary
· Deal with future development – allows development, but does not make drainage worse
·
· Development requirements that allow percolation of water into the soil (ditches, retention basins, etc.)
· Suction pressure feed pumps to move water out of the retention ponds, regardless of river height
· Three or four locations (including areas where water already collects) for water retention systems, then grates and suction/pumps to move water from those places to the river
Some
communities are now using “green” solutions such as wetlands and riparian
setback buffers to reduce the rate of stormwater run off. Do you think a
“green” solution is better for
· Problems with retention because of local concerns about mosquitoes, etc.
· Setbacks are a good idea
· Allowing water to re-infiltrate would be excellent
·
· Already required to some degree (setbacks)
· Probably ideal, given topography - question is to what degree
· Likes idea of combining retention areas with recreation facilities – perhaps creation of a permanent lake/pond in combination with water retention
·
·
Do not want water to stand too long – mosquitoes,
Do
you think
· Along highway – industrial/commercial development
·
Residential –
· Needs to be more development
· Development rules should be appropriate for area, especially related to affordable/low-income housing
·
· More development to the north of town and turnpike; residential between river and turnpike
· Rezone for bigger lots (1/4 acre); make sure development patterns do not increase drainage problems or cause increased flooding/problems for neighbors
· Avoid use of clay soils, which do not allow infiltration, as fill
·
Should land use planning address management of stormwater runoff? If so, how?
- Definitely
- Need new development, but must also deal with impervious areas
- Use modern stormwater management techniques, like infiltration
- This study should reduce need for individual water management studies, at least in a general sense
- New flood standards already impose some requirements throughout community
- Looking to this study for guidelines for development
- Absolutely
- Not against development, but it must be planned and cannot jeopardize existing homes and businesses
- Long-term solution has to manage water north of the turnpike
What should new streets
in
- Need curbs; hard to get ditches to work correctly because of flat topography
- Open ditch is at least part of the solution
- Existing streets are too narrow for curb & gutters
- Ditches are good because they allow infiltration/percolation, but not large ditches like those that have been built in some areas because they hard to mow and maintain
Do you or your constituents have additional concerns that we should know about?
· Need to get the public involved; need to hear their concerns
· Do not be too restrictive on future development
· Do not harm value of land – older residents are counting on ability to sell land
· Some of the new developments/housing have created problems for long-term residents in terms of additional run-off – fallout is that there is contention between neighbors; developers need to be held accountable
· Study needs to present workable, realistic solutions to drainage problems
Who else do we need to make sure to include in the process?
·
Douglas
· Elected officials
·
Planning
· Developers
How do most people in your community get their news/information?
·
· TV 6
· Post notice at Depot; Johnny’s Bar
B. Area Business and Resident Survey
On
The majority of the responses reflected property-specific concerns and problems. Standing water in the area and associated concerns about mosquito control were among the most common problems noted. Recurring concerns related specifically to development patterns, current stormwater management practices and future construction impacts, as well as a desire to limit new development. With those comments came concerns about enforcement of stormwater management controls with new development and construction. The concerns were both in terms of fears of too great of restrictions and desires for stringent development controls.
Survey questions and responses:
How often in the past 10 years have you had a problem with stormwater on your property?
[ 32 ] – 0 times
|
Address |
Frequency |
|
1567 Hwy 40 |
Yes |
|
1728 E. 1500 Road |
Twice really bad, but every time with a heavy rain |
|
1804 E. 1600 Road |
15 |
|
1480 N. 1700 Road |
Too many to count |
|
1662 N. 1700 Road |
3 or 4 |
|
792 N. 2nd |
Several |
|
645 N. 3rd |
Frequently |
|
1001 N. 3rd |
1993 & 1997 |
|
624 N. 5th |
1 |
|
725 N. 5th |
8 |
|
649 N. 6th |
Every time it rains |
|
625 N. 7th |
Every time it rains |
|
227 N. 8th |
1 |
|
625 N. 8th |
2-3 times over the last two years |
|
769 Ash |
5 |
|
600 |
When it rains |
|
310 Elm |
20 |
|
411 Elm |
Every time it rains |
|
761 Grant |
When it rains more than 1 day |
|
711 Maple |
2 |
|
819 Maple |
Every time it rains |
|
|
2 |
|
403 |
4 |
|
624 |
During heavy rains |
|
641 |
|
|
628 Locust |
Ongoing |
|
788 Locust |
Every time it rains |
|
806 Locust |
|
|
818 Locust |
Yearly |
|
836 Locust |
10 |
|
520 |
2 |
|
835 |
20 |
|
|
Often |
|
|
Every time it rains |
|
501 Perry |
Every 1" or more |
|
517 Perry |
2 |
|
304 Pleasant |
Too many to count |
|
786 Walnut |
Every time it rains |
What types of problems have you had? Never Sometimes Often
Erosion [ 37 ] [ 20 ] [ 5 ]
Home or business flooded [ 45 ] [ 10 ] [ 4 ]
Over flowing ditches/culverts [ 22 ] [ 23 ] [ 26 ]
Standing water outside [ 22 ] [ 28 ] [ 30 ]
Street or driveway access flooded [ 32 ] [ 24 ] [ 21 ]
Other:
- 1480 N. 1700 Road – pasture flooded/electric fences out of service
- 1567 Hwy 40 – Farm fields due to inadequate landscaping and car accidents in Hwy 24/40 due to flooding
- 1662 N. 1700 Road – Water runs across road into our field
- 1735 E. 1500 Road – Front ditch plugged
- 628 Locust –
- 800 Walnut – Water does not pass through culvert under drive
- 818 Locust – Storm runoff from several nearby properties, mainly from the east of our property
- 827 Maple – some ditches do not drain
- Ditches and culvert need to be cleaned
- Fields with standing water
- I have noticed the (train) underpass flooded on
- Mainly standing water in culverts
- Mosquitoes
- Mosquitoes due to standing water (health hazard)
- Mosquitoes heavy/standing water
- No curbs on streets
- Problem corrected with cleaning ditches and culverts
- Water backing up in basement
- Water crosses road and erodes ditches that we
mow; I’ve seen 6” – 8” of water pooled at
What do you see as major
storm water problems in your area? (
[ 61 ] Poor drainage
[ 37 ] Excessive run-off from streets
[ 35 ] Loss of property values
[ 31 ] Flooding
[ 13 ] Trash removal/odors
[ 12 ] Loss of property through erosion
[ 8 ] Poor water quality
[ 7 ] Loss of natural habitat
[ 4 ] Unsafe stream/stream bank conditions
Other:
- 1662 N. 1700 Road – Road contour to keep water from running into our field
- 1804 E. 1600 Road – Runoff from airport
- 800 Walnut – Redo the ditch created in my yard, which was not done properly anyway; also do something about the property across the street
- Drainage driveway tubes block or no tube at all
- Hazard of flooding at 1732 & 1500 E. Road
- Inadequate ditches along major highway 24-40
- Install curb and gutter on some streets
- Lack of curb and gutters
- Loss of use of pasture
- Main concern is river flooding and levy breaks
- Mosquitoes!
- Mosquitoes from improper drainage in easement
- Need storm drain
- No drainage
- No stormwater system
- No well planned stormwater control at all – we are fortunate at least to have sandy soil to absorb the water
- Poor alley upkeep holds water all the time when it rains
- Standing water
- Uncared for property
What types of stormwater
management tools do you think would best correct the problem? (
[ 48 ] Stormwater inlet and pipe systems
[ 45 ] Limit new construction that does not absorb stormwater (impervious surfaces)
[ 30 ] Enhanced natural waterways
[ 23 ] Pump stations
[ 18 ] Open channel drainage systems
[ 15 ] Stormwater retention lakes/lagoons
Other
- All runoff from impervious surfaces should be retained onsite
- Appropriate ditches along highway 24-40
- Better code enforcement by city, proper grading of drainage easement
- Drop us from the floodplain
- Find out why ditch west of 1500 east will not carry water when we have heavy rains; east ditch is fine
- Keep equipment from collapsing storm ditches and culverts
- Keep things maintained on a regular basis
- Make sure drainage ditches are in the proper areas and maintained
- Maybe if the city took care of the ditches – cleaning/fixing/maintaining etc.; sometimes you clear your ditch but the neighbor does not and the water stays
- No stormwater retention lakes/lagoons – too many mosquitoes already
- Pump stations – expensive to maintain – tax increase
- Put in curbs and gutters
- Stormwater detention that is underground
- Study low points and promote natural drainage into storm drains
Development patterns can
impact how stormwater is best managed. How do you think
- Limit on amount of impervious surfaces as percent of pervious; enforce pervious fill regulations – a 30 degree clay slope is not pervious in a practical sense; require use of permeable paving such as gravel and open pavers; offer rebates to homeowners installing such paving, whether new or replacement; also to install cistern systems
Homes
[ 51 ] Large (1/4-acre+) home lots
[ 37 ] Suburban-style single-family
[ 6 ] Apartments and/or town homes
Other:
- Large lots to keep areas for gardening - this is the best soil for raising food and flowers
- Limit development
- None
- None
- Residential single family homes
- Restrict residential development
- Very large ½ acre-plus home lots
Business
[ 35 ] Light industrial
[ 32 ] Office
[ 30 ] Agricultural
[ 6 ] Heavy industrial
Other
- Light industrial north of turnpike
- None
- None
- Small business
Retail/Restaurant
[ 47 ] Stand-alone storefronts
[ 18 ] Grocery Store
[ 12 ] Strip malls
[ 7 ] Enclosed malls
Other
- More grocery and variety stores
- No bars
- NO MORE – current impervious areas are WAY under-utilized.
- No retail
- None
- None of these; this mess that
- None or vertical – maintain footprint
- Pharmacy, hardware store, banking facility, laundry
- Sit-down family restaurant besides
- Strip malls – limit two
- Use Tanger Mall I-70
Business
- We have empty stores and malls - let’s use them!
Additional comments or suggestions:
Site-Specific
- 1480 N. 1700 Road – My farm lies at the first
low spot north of the pump station on Maple Grove Tributary, the
confluence of the MGTJ with the ditch that drains
- 1502 N. 1732 Rd. - Please come by and visit with
me. We have been living here since 1958 (46 years). I’ve
personally done a lot of work to improve drainage on my property …
grading, fill dirt, waterways, etc. The biggest single problem is
drainage on
- 1728 E. 1500 Road - Dale Black had a pond of some type dug on his property for fill dirt to raise the height of a modular home installed across from my property. Since that time there has been a severe water problem coming across N. 7th (E 1500 Road) and into my front ditch from his property. This has caused erosion in my ditch and driveway. I also think their driveway culverts are too small to handle the water flow. I do know I have lived at my property for 40 years and never had this problem until the modular home was installed. Twice water overflowed my front ditch and came halfway across my front yard – all from the excessive run-off from across the road at Black’s property.
- 403
- 440
- 501 Perry - We have a ditch on 2 sides of our property and the neighbors to the east do not even have a drainage tube or ditch, so between runoff and that, we have quite a bit of water standing for a while after a rain.
- 520
- 5th & Perry - The older houses in our area seem to suffer the worst – even moderate rains flood the yard at NW 5th and Perry. Heavy rains flood the intersection.
- 600-700 block
- 625 N 7th - Stormwater stands in ditch in front of my house because the tube under my driveway is higher than the bottom of my ditch. The sides of my ditch are too steep to mow. I wish there wasn’t a ditch in front of my house. I would prefer to have storm sewers instead.
- 628 Locust – Neighbors and I have had problems
with a drainage easement. It is not graded properly.
- 700 block of N. 7th does not drain.
- 760 N. 5th - David Krouse has been notified two times about our standing water problem.
- 761 Grant - The lot behind my property is owned by a church. They rarely mow it - hardly ever mow the ditches between property. Those weeds get to be 10 feet high. The east ditch does not drain. It holds a good amount of water (mosquito lagoon). This has been a concern for several years. All I can suggest is that the ditch be redone and filled with a drainable base so weeds won’t grow so bad, and maybe some other things. Please look at it.
- 786 Walnut - When electricity is off, lift station shuts off and water backs up into our basement. Need alternative energy source to keep pump station working. Also persistent bad odor in outside air due to lift station. Need to burn off excessive sewer gases to prevent smell in area.
- 8th &
- 800 Walnut – Rainwater did not stand on my property prior to improvements made a few years ago. The culvert pipe under my driveway was dug up, then put back in place. Unfortunately, it was not done carefully and water doesn’t flow through it well as it is too high now. Also the ditch created by the city has a depression right by the entry to the east of the pipe that allows water to pool. When they dug up my front yard to make the ditch (which really was not needed on my side of the street) it was done by eye. No on used any plum line or other visual aid to see if water would flow toward the inlet pipe; they just eyeballed it. The resulting ditch has walls that are uneven and very difficult to mow. They did not plant grass on my property, although they did re-seed and cover my neighbor’s property to the north, across the street. Finally there was a second culvert/driveway to the east of my driveway. It belonged to my neighbor according to him, but technically about 1.5 feet of it was on my property. He talked the workers into moving it a few yards to the east. Water does not flow well between these two culverts now, and standing water develops during/after steady rain. There needs to be a better drainage system across the street. My yard needs to be either re-done so it is both mowable (easily) and drains well, or redone so that water flows toward the inlet better. The area east of my drive needs to be redone (with small depression filled) and perhaps the culvert pipe replaced or moved (although filling in the depression should do). Over the years, I have tried to dig here and there to promote flow. This is a small problem, but since I had no problem before it is important to me. Also I contacted the city about this years ago; to no avail.
- 9th and Locust; fix culverts and clean ditches; anything would help.
- First impressions for those traveling into
- I suggest paving the streets, eliminating the
deep ditches, install storm sewers, clean frequently, Wow!
- I would like to have ditches replaced with stormwater drain system so ditches would be gone and have ground level and put sidewalks along streets at least on 1 side. A lot of people like to walk dogs and exercise and street (7th) is very narrow and dangerous. Thanks for your help!
- I would love to see the ditches removed and
replaced with drainage systems. Most ditches in
- My property is elevated high enough that I don’t
have a problem with it. However, the property to the rear with a
field floods more and more now that many inbound lots are built on.
- Need curbs
- Stop bringing clay for fill. Our ditches don’t need to be dug out any deeper. The ones that have been dug out deeper are not getting mowed.
- The alleys in
- We would like to see more curb and gutters instead of ditches. The height requirements for new lots seem too high, especially when a new lot is built up next to an established residence. Great improvements have been made since 1993.
- Would like for sewer lines and stormwater lines to be separated.
Development & Planning
- Elevated buildings should be removed and
returned to the condition they were in previously. Building those
homes up like that was a slap in the face of
- Grade new construction so water does not pool on
existing undeveloped property on floodplain. New pump station has
improved water management.
- I think all deep ditches where new homes are
built should have enclosed drainage under driveways connecting – example
700 block of
- Large lots for housing – to keep this excellent soil for gardens. Large developments need excellent engineering so large impermeable surfaces do not overwhelm storm drainage systems. Natural drainage areas – grassy – contoured for mowing work well most of the time because our soils allow water to move through them quickly.
- Let
- Mr.
- My property is located in the highest part of NL so I have had no water problems. Most of the problems are on the north side of the tracks (the lowest part in NL). New home development has really grown (especially in the lower part) on every vacant lot available – elevating these buildings has only increased the runoff on older existing homes.
- Our incredibly rich, well draining native soil is some of the best agricultural soil in the world. We should treasure it for its best use – food for people – and not pave or build on it.
- People like to live in
- Preserve green space to allow absorption of runoff. Larger lots, less concrete (drives, patios, etc). Better management of ditches. Ours is so uneven in the bottom, water is always in it making it hard to keep weeds cut. When ditches are cleaned out, adjacent property owners should be allowed to have some of the soil back on their property.
- Storm water poses a major impediment to
redevelopment of
- Take a drive around
- The mosquitoes are terrible due to the standing
water in the ditches of the 700 block of
- The street side open ditch drainage system for
the 700 block of
- The town homes would be great for retired or single females, males who really can’t tackle lawn work or repairs.
Miscellaneous
- I have not had any problems with stormwater so I would not like to see any policies or procedures that would cost me in either taxes or fees, or loss of property value through increased regulation.
- I would like my property at 2nd and Locust re-zoned so I can build a salon there.
- My home hasn’t flooded since the 1951 flood.
- Present builders keep their property mowed and
cleaned (example 4th &
- Smell from water treatment plant!
- When will I get rural water?
On
The meeting was publicized through the mailed survey and through a press release to local media. There was also a notice on the North Lawrence Improvement Area Website.
Exhibits
included information on various stormwater management tools, an overview of
plans and development for
- 616 Locust –
- 628 Locust – Problem with water ponding on south road ditch (neighbor at 624 has had
water problems). Development problem?
- 904 N 7th – Standing water in backyard; also, poor drainage in front yard. Ditch is very shallow. Ends of pipe are crushed - would like it repaired. Sump in backyard does not drain; concerns with mosquitoes. Ponds a couple of days after rains. Also concerned with house to the north, which is unoccupied and rarely maintained.
- 5th & Levee – Pipe drains under levee, but roadway ditch (with minimal area) is generally dry (not really a problem)
- Likes idea of ponds with pipes and pumps at
central locations, such as adjacent to
- Oak between 8th & 9th: Drainage problem has been fixed with removal of old structure
- Planned clean-out of ditch and culverts on Walnut
- 300 block of Funston already cleaned – money
acquired by NLIA; maintenance of culverts, ditches and pipes are an
ongoing concern, including culverts at
- 701 Maple –
- 513 Lincoln – 8 year resident, no serious
flooding issues. Noted that
- 818 Locust – culverts along locust, ponds on property
- 308 N. 8th – 1993 sink hole at 2nd and Locust.
- 422 Locust, next to Tropicana. Locust floods; basement floods although not much in past couple of years since the Tropicana parking lot was built. Low place in yard collects Locust run-off after heavy rainfall and ponds – stays flooded for one day or so.
- 7th &
- 3rd & Perry – NW corner – water in basement through rock wall. Started after city sanitary sewer work that penetrated clay layers.
- 3rd &
- 820 Oak – Recent Monday evening rain, standing water on most streets, including bridge.
- Did not like survey or meeting time; pit problems adds to street
D.
Members
of the project team provided an overview of study activities and public input
to the Lawrence Planning
Section III:
To accomplish the goals of the North Lawrence Drainage Study, the ultimate land use condition had to be determined for the study area. The future land uses within the watershed will help determine where to focus the stormwater system improvements and provide better insight into heading off potential problems with development. The project team conferred with the Public Works Department, the Planning Office, and the Utilities Department of Lawrence. Information was gathered with regard to current zoning, potential developments, and long-range plans.
A.
The
study team was tasked with developing possible future land uses for the
A
second key assumption deals with the purpose of the ultimate future land use
map. The study utilized Horizon 2020 as a resource for the creation of
the Build-Out Scenario Map. However, it should be noted that Horizon 2020
is the guiding policy document which defines a land use vision for the next
twenty years. This drainage study was tasked with developing a plan for
ultimate build-out which will reflect possible land uses beyond a twenty year
horizon. For this reason, possible future land uses were identified
outside of the Horizon 2020 Plan area to reflect ultimate growth within the
study area. As a rule, Horizon 2020 land use delineations and definitions
were used in the final scenario map. The Build-Out Scenario Map was
developed for the drainage study for the purpose of determining the impact of
an ultimate development scenario. It is not a policy document and may not
reflect best planning practices. The Lawrence
B.
Understanding
the importance of input and concurrence from
Q/
A: The Parks and Recreation Department was contacted to inquire about a long-term plan for parks, open space, and trails. Parks and Recreation are currently in the process of developing a plan and standards for developing areas. However, to date, no plans have been delineated for the project study area beyond Horizon 2020. The Build-Out Scenario Map was amended to show floodplain and open space areas as well as riparian corridors for possible green space connections. As previously mentioned, the goal of this effort is not to develop a policy map. Rather, the intention is to delineate how the study area will likely develop at build-out.
Q/
A: The Build-Out Scenario Map
was changed to reflect the 100-year floodplain areas for the study area.
Best practices advocate that these areas be delineated as permanent
agricultural or at least Very Low Density Residential. However, there are
few tools available to FEMA, the
Q/
A: As mentioned previously, we amended the Build-Out Scenario Map to reflect the Horizon 2020 as closely as possible. For the purposes of this study, some land use delineations were combined (there are several categories of industrial and office) to simplify designations. Additionally, some of the low-lying areas were designated Agricultural. It is assumed that an average density within these areas is 1 Dwelling Unit per 5-Acres. The balance of the designations on the Build-Out Scenario Map is consistent with Horizon 2020.
The
industrial and commercial trends are expanding along the highways. Best
practices advocate a clustering of these uses at designated nodes with access
to infrastructure and compatible uses. This policy is reflected in
Horizon 2020. The study team amended the Build-Out Scenario Map to show
commercial areas along the Highways and intersections of major roads.
Industrial developments are shown near the
Q/
A: The KU Endowment
Association was contacted during the study. The Association does own a
substantial amount of property around the airport (approximately
220-acres).
Q/
A: As mentioned previously, we amended the Build-Out Scenario Map to show riparian corridors. Parks and Recreation is in the process of developing a plan and standards for future development areas.
Q/
A: Future suburban areas are unlikely to develop at the same density as areas within the established core. The task within this drainage study requires developing densities for areas outside of Horizon 2020. Prevailing trends show that a majority of development in suburban areas consist primarily of single-family detached homes with approximate densities of 3 units per acre. To reflect these trends, the designation “Suburban Residential” is provided on the Build-Out Scenario Map for areas outside of Horizon 2020.
Q/
A: This is reflected in the latest Build-Out Scenario Map.
Q/
A: As mentioned previously, the Build-Out Scenario Map was updated to show the designation of Agricultural. The study team agrees that some areas are likely to remain in agricultural use while other areas may develop at very low densities. We assume that future development will follow Horizon 2020 policies that encourage residential clustering. A probable build-out assumption for these areas would be an average of 1 dwelling unit per 5-acres.
Q/
A: The Build-Out Scenario Map was amended to show this area as Agricultural.
Q/
A: The intended purpose of the Build-Out Scenario Map is developing probable land uses at build-out for the drainage model. Bike routes and other information that is usually depicted on land use plans and development guides have not been included.
Q/
A: Part of this was a scale issue. However, the commercial node on the Build-Out Scenario Map was modified to show a modest expansion of this area reflecting growth beyond the time horizon depicted in Horizon 2020.
Q/
A: Again, the purpose of the Build-Out Scenario Map is to anticipate development beyond Horizon 2020. For the purposes of this exercise, it was prudent to show realistic expansions of commercial. However, further review led to the final version of the map showing this particular area as agricultural.
Q/
A: The
Q/
A: The Build-Out Scenario Map
is not a policy document; it is for study purposes only. The industrial
land use designations pointed out in the comment from the North Lawrence
Improvement Association are within the Lawrence
Q/
A:
The final scenario map used in the hydrologic analysis of the study contained the land use categories shown in the table. Several defined uses for residential were used to demonstrate the likely variance in potential development.
Land Use

The next page is the final Build-Out Scenario Map produced for the North Lawrence Drainage Study.
Link to diagram: North Lawrence Drainage Study Build-Out Scenario Map
Section IV: Data
A. Field Investigation
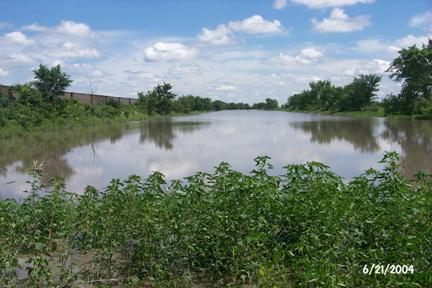
Several field visits were made to observe drainage patterns, take photographs, and verify structure sizes and orientations. A few photos of significant features are shown below.
Ponding
downstream of 1400/1900 intersection, south of
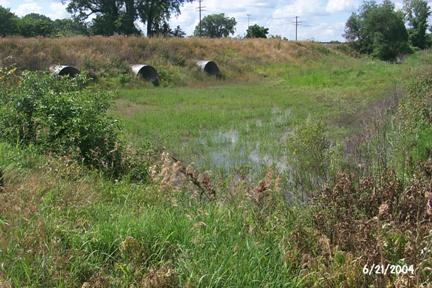
3-108”
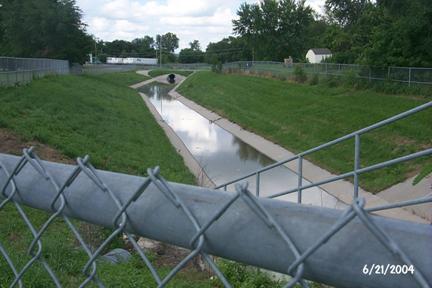
Tributary B, near the mouth
B. Surveys
The
entire drainage system in the
· Location
· Structure type
· Size
· General condition
· Flow line elevations
· Overtopping Elevations
Inlets
· Location
· Grate/curb dimensions
·
· General condition
· Invert information
· Flow direction
· Size of incoming and outgoing pipes
· Depth and elevation of incoming and outgoing pipes
Manholes
· Location
· Rim/cover/barrel elevation
· Wall material
· Invert type and condition
· Depth (rim to flow line) and pipe diameter
Open
·
This information was used in the development of computer models. Information from the field survey forms was entered into the GIS database and mapping.
The
basis for the evaluation of the
The
Two
reports reviewed, “Internal Drainage Study, North Lawrence Flood Protection
Unit” and “
Link to diagram: North Lawrence Watershed Surveys 1
North Lawrence Watershed Surveys 2
Section V: Internal Drainage System Analysis
Link to diagram: Internal Analysis
The
system of
A. General Methodology
The
drainage area contributing to stormwater system infrastructure within the
The approach to determining appropriate improvements for the North Lawrence Drainage Study’s internal drainage system began with several guiding principles:
- In areas not near a pump plant, increase pipe sizes and/or channel capacity
- At the
- Investigate the adequacy of the
- Detention should be accomplished on existing topography – avoid excavation
- If ditch sizes are increased, avoid changing the slope
- Do not modify pipes extending through the levee
Taking these items into consideration, the 12 individual systems were analyzed. As each one was modeled, the determination was to be made if that system would remain separate or potentially contribute flow to another system. The 10-year event was run for each existing network of manholes, inlets, junction boxes, pipes, and channels to determine problem areas and provide recommendations for those areas.
B. Findings and Recommendations
Results
of the hydrologic and hydraulic analyses for the set of 12 systems representing
the existing stormwater infrastructure within
For areas that drain by gravity flow to the river (no pump plant), various pipe and channel configuration upgrades were tested. The shallow cover on most of the pipes within the drainage network did not allow for keeping the same slope in the line. Usually, to eliminate a ponding situation, most of the system had to be redesigned. In other words, increasing pipe and channel sizes in conjunction with changing grades was necessary. The structure draining through the levee, however, was able to remain in place with the recommended redesign of the upstream portion of the system in all of these situations.
The
second case is where the system is essentially self-contained (flowing to a
low-lying area) and the analysis shows that it has areas of surcharge or ponding. The total volume of ponding
was compared to available ponding area at that
location. If adequate volume was available, then no recommended changes
were necessary. The recommendation only includes the cost of acquiring
the parcel(s) of land that is used for ponding.
If the volume available according to surveys and contour information was
inadequate, then the flow might need to be re-routed at one or more
locations. The three cases for
A
final situation involves the systems which include the
Recommendations were determined for each conduit or channel in a system based on the analysis of the entire system. It should be noted that improvements are to generally be made in a downstream to upstream manner within the system, as there is no advantage trying to deliver more flow to a downstream component that cannot convey the existing flow. Overall costs for each system upgrade are summarized in the spreadsheets on the following pages. However, for the purposes of prioritizing public improvements on a smaller scale, excess peak flow was determined for each lateral draining to the main stem of the system. A comparison of the discharge through the existing lateral at the main stem location - that which does not surcharge and exit the lateral somewhere along its path - and the recommended configuration provided the excess flow values. The excess peak flows were also recorded for the most downstream pipe or channel on the main stem of each system. The most downstream conveyance link of a system is the only item included in prioritization for some systems because the drainage area of the entire system is relatively small (less than about 100 acres) and no laterals were modeled. A priority listing encompassing the 12 system study area is given in the table.
|
Prioritization of Systems |
||
|
Link Name |
|
Total Estimated |
|
(cfs) |
(dollars) |
|
|
S1-1 |
315 |
$9,163,000 |
|
S6-1 |
168 |
$3,994,000 |
|
S9-1 |
133 |
$1,132,000 |
|
S1L1-1 |
96 |
$333,000 |
|
S1L5-1 |
85 |
$235,000 |
|
S1L7-1 |
85 |
$59,000 |
|
S1L3-1 |
56 |
$187,000 |
|
S6L3-1 |
56 |
$195,000 |
|
S6L3-7D |
0 |
$181,000 |
|
S4-1 |
43 |
$60,000 |
|
S6L2-1 |
37 |
$5,000 |
|
S4L4-1 |
35 |
$53,000 |
|
S4L2-1 |
27 |
$36,000 |
|
S9L1-1 |
21 |
$7,000 |
|
S1L2-1 |
20 |
$240,000 |
|
S8-1 |
17 |
$115,000 |
|
S10L2-1 |
13 |
$4,000 |
|
S7-1 |
13 |
$38,000 |
|
S5-1 |
10 |
$56,000 |
|
S10-1 |
6 |
$106,000 |
|
S1L4-1 |
1 |
$7,000 |
|
S1L6-1 |
0 |
$0 |
|
S11-1 |
0 |
$0 |
|
S3-1 |
0 |
$0 |
|
S2-1 |
0 |
$0 |
|
S12-1 |
0 |
$0 |
|
Total |
0 |
$16,206,000 |
The
costs shown in the table provide a conceptual level estimate of capital costs
to implement the recommendation for each lateral. Labor and construction costs
are included, but items such as engineering design and maintenance of those
structures are not. Unit prices for labor and construction were obtained
from the 2005 RS Means
It is important to note that specific conditions of a site can significantly affect the cost to replace structures or implement other solutions. Extraordinary circumstances were not taken into account for the conceptual level costs determined by this study. Reasonable unit costs were determined and applied to recommended improvements across the entire study area. Also, the implementation costs for recommended improvements on the laterals do not reflect the main stem improvements that may be necessary in conjunction with the lateral improvements. In other words, whatever portion of the main stem is recommended for improvement downstream of the lateral should be implemented at the same time (or prior to) as the lateral improvements. The cost of the lateral improvement in the listing, however, is exclusive of that downstream cost.
The
next several pages provide details of the recommendations for the individual
systems included in the internal system analysis portion of the study. A
description is followed by a map of the system identifying each conduit,
channel, or pump plant that is recommended for improvement and its respective
cost. The two numbers below the cost figure (shown as X/Y) represent a
comparison between full-flow capacity of the existing conduit and the flow
through the recommended conduit. Additional detail for pipe and grade changes,
as well as pump plant upgrades, is shown on the spreadsheets for each
system.
1. System 1
System
1 has a pressure flow outlet pipe through the levee originating from the
· SlL1 – The excess peak flow in S1L1-1, the pipe discharging to the main stem of System 1, is 96 cfs. Almost all of the points along the lateral were shown to be surcharging. Minimal cover and slope issues forced the entire lateral to be redesigned. A more consistent grade was set and sizes were changed on a segment-by-segment basis in order to eliminate surcharge points. The process continued until each component of the lateral could handle the flow without surcharge. Eight out of nine pipes have recommendations for size change, while all have slope changes.
· S1L2 – The excess peak flow in S1L2-1, the channel discharging to the main stem of System 1, is 20 cfs. A majority of the points along the lateral were shown to be surcharging. Minimal cover and slope issues forced most of the lateral to be redesigned. A more consistent grade was set and sizes were changed on a segment-by-segment basis in order to eliminate surcharge points. By improving one situation, problems often progressed to (or added to flooding problems at) adjacent pipes. The process continued until each component of the lateral could handle the flow without surcharge. All 20 pipes/channels have recommendations for size change; while 17 have slope change recommendations.
· S1L3 – The excess peak flow in S1L3-1, the channel discharging to the main stem of System 1, is 56 cfs. All of the points along the lateral were shown to be surcharging. Minimal cover and slope issues forced the entire lateral to be redesigned. A more consistent grade was set and sizes were changed on a segment-by-segment basis in order to eliminate surcharge points. The process continued until each component of the lateral could handle the flow without surcharge. All 10 pipes/channels have recommendations for size and grade changes.
· S1L4 – The excess peak flow in S1L4-1, the channel discharging to the main stem of System 1, is 0 cfs. No changes in size or slope are necessary for these pipes.
· S1L5 – The excess peak flow in S1L5-1, the channel discharging to the main stem of System 1, is 85 cfs. A majority of the points along the lateral were shown to be surcharging. Minimal cover and slope issues forced most of the lateral to be redesigned. A more consistent grade was set and sizes were changed on a segment-by-segment basis in order to eliminate surcharge points. By improving one situation, problems often progressed to (or added to flooding problems at) adjacent pipes. The process continued until each component of the lateral could handle the flow without surcharge. All 11 pipes/channels have recommendations for size and slope change.
· S1L6 – The excess peak flow in S1L6-1, the pipe discharging to the main stem of System 1, is 1 cfs. This is the only pipe in the lateral, and a change in grade is recommended. The size of the pipe was determined to be adequate for the ultimate build-out condition.
· S1L7 – The excess peak flow in S1L7-1, the channel discharging to the main stem of System 1, is 84 cfs. All of the points along the lateral were shown to be surcharging. Minimal cover and slope issues forced the entire lateral to be redesigned. A more consistent grade was set and sizes were changed on a segment-by-segment basis in order to eliminate surcharge points. By improving one situation, problems often progressed to (or added to flooding problems at) adjacent pipes. The process continued until each component of the lateral could handle the flow without surcharge. Five out of six pipes/channels have recommendations for size change, while all have slope changes.
Link to Cost estimate: System 1
Link to diagram: Internal Analysis, System 1
2. System 2
This
system has a gravity flow outlet through the
Link to Cost estimate: System 2
Link to diagram: Internal Analysis, System 2
3. System 3
This
system has a gravity flow outlet through the
Link to Cost estimate: System 3
Link to diagram: Internal Analysis, System 3
4. System 4
This
system has a gravity flow pipe outlet to the
- S4L2 – The excess peak flow in S4L2-1, the pipe discharging to the main stem of System 4, is 27 cfs. One of the points along the lateral was shown to be surcharging. In order to provide an adequate conveyance system, all four of the pipes are recommended for size increases. However, the existing grades can accommodate the new sizes.
- S4L4 – The excess peak flow in S4L4-1, the pipe discharging to the main stem of System 4, is 35 cfs. Both the discharge pipe and the one other pipe along the lateral were shown to be surcharging. In order to eliminate the ponding, size increases are recommended. As with the other System 4 lateral, the existing grades can accommodate the new sizes.
Link to Cost estimate: System 4
Link to diagram: Internal Analysis, System 4
5. System 5
This
system has a gravity flow outlet through the
Link to Cost estimate: System 5
Link to diagram: Internal Analysis, System 5
6. System 6
This
system contains the
Based
upon a specific standing water concern in the block between 7th, 8th,
Lincoln, and Lyon Streets, an alternative for Section 6 looked at re-routing
some discharge to System 10. It turned out that diversion of a portion of
flow to System 10 provided an overall cost savings. While there was
additional cost for placing a new pipe along
Even
with the flow diversion, though, local drainage would continue to cause some
standing water due to the fill currently being placed on the east side of the
lot. The
On the main stem of System 6, 7 out of 16 pipes are recommended for a change in slope, while all are recommended for an upgrade in size. A breakdown of each lateral coming into the main system is given below. A map of this system identifies all recommended improvements along with an estimated total cost. Additional detail for improvements is shown on the System 6 spreadsheet.
- S6L2 – The excess peak flow in S6L2-1, the pipe discharging to the main stem of System 6, is 37 cfs. This is the only pipe meeting study criteria for hydrologic analysis on that branch of the system. In order to provide an adequate conveyance system, the pipe is recommended for a size increase and a grade change.
- S6L3 – The excess peak flow in S6L3-1, the pipe discharging to the main stem of System 6, is 56 cfs. All of the points along the lateral were shown to be surcharging. Minimal cover and slope issues forced the entire lateral to be redesigned. A more consistent grade was set and sizes were changed on a segment-by-segment basis in order to eliminate surcharge points. The process continued until each component of the lateral could handle the flow without surcharge. All 10 pipes/channels have recommendations for size and grade changes.
Link to Cost estimate: System 6
Link to diagram: Internal Analysis, System 6
7. System 7
This
system has a gravity flow outlet through the
Link to Cost estimate: System 7
Link to diagram: Internal Analysis, System 7
8. System 8
This
system has a gravity flow outlet through the
Link to Cost estimate: System 8
Link to diagram: Internal Analysis, System 8
9. System 9
This
system has a gravity flow outlet through the
The levee pipe cannot handle the additional flow delivered by the upsized pipe network upstream. Water will surcharge from the end of pipe S9-2 and overland flow into the ponding area denoted in the map. In a more populated area this would require construction of a pump plant to take the water to the river, but at this point it runs to an uninhabited area. Further investigation and land acquisition purchases may be necessary prior to future development in the area. For the current situation, though, it is recommended to keep the existing infrastructure in place at the levee location.
A breakdown of each lateral coming into the main system is given below. A map of this system identifies the recommended improvements along with an estimated total cost. Additional detail is provided on the System 9 spreadsheet.
- S9L1 – The excess peak flow in S9L1-1, the pipe discharging to the main stem of System 9, is 21 cfs. This is the only pipe meeting study criteria for hydrologic analysis on that branch of the system. In order to provide an adequate conveyance system, the pipe is recommended for a size increase and a grade change.
Link to Cost estimate: System 9
Link to diagram: Internal Analysis, System 9
10. System 10
This system drains to a low-lying area on the east side of its drainage area. Each conduit was analyzed with regard to capacity during a 10-year flow event. A method of upsizing pipe and changing grade from downstream to upstream was utilized to eliminate those that were over capacity. A total of seven pipes/channels met criteria for analysis in System 10 (11 pipes are shown in GIS), of which 5 are exceeding capacity. On the main stem, the solitary pipe is recommended for an upgrade in size only. Of the three channels, none are recommended for an upgrade in size, but all four have recommended changes in slope. The ponding area spreads across parts of three properties. It is recommended to purchase these properties rather than convey the stormwater elsewhere.
A breakdown of each lateral coming into the main system is given below. A map of this system identifies all recommended improvements along with an estimated total cost. Additional detail for improvements is shown on the System 10 spreadsheet.
- S10L2 – The excess peak flow in S10L2-1, the pipe discharging to the main stem of System 10, is 13 cfs. Both the discharge pipe and the one other pipe along the lateral were shown to be surcharging. In order to eliminate the ponding, size increases and grade changes are recommended. The channel in between the two pipes adequately conveys flow through the system, so it is recommended to leave that existing infrastructure in place.
Link to Cost estimate: System 10
Link to diagram: Internal Analysis, System 10
11. System 11
This
system flows by gravity to a low-lying area on the north end of its drainage
area. Only the outlet channel met the study criteria of having an
individual drainage area in the hydrologic model, and therefore could be
analyzed with regard to capacity during a 10-year flow event. However, an
additional six pipes and five natural channels are included in the GIS mapping
for the system. The outlet pipe was determined to be adequate and the
recommendation is to keep the existing infrastructure in place. The ponding area sits on a single parcel of land which the
Link to Cost estimate: System 11
Link to diagram: Internal Analysis, System 11
12. System 12
This
system has a gravity flow outlet through the
Link to Cost estimate: System 12
Link to diagram: Internal Analysis, System 12
To represent the location of each component within its respective piping network or system, a unique identification was provided. These designations are utilized within the GIS database and the XP-SWMM models. An “S” designation followed by a number is representative of the “System” that the component is within. An “L” refers to the “Lateral” within the specific system that is branching off of the main stem. A “T” refers to “Tributary” and represents the branch coming off of the lateral within the system. All numbers are consecutive and were labeled from downstream to upstream. A final number after a dash is simply the pipe or channel number. Two examples of the naming convention are provided below:
S1L2T1-2
identifies a component that is in System 1, Lateral 2,
Tributary 1, and Pipe/
S6L6-10
identifies a component that is in System 6, Lateral 6,
and Pipe/
D. Hydrologic and Hydraulic Analyses
The hydrology of the watershed is defined by the rainfall-runoff process. APWA Section 5600 requires that the Rational Method be used to calculate peak rates of runoff to elements of enclosed and open channel systems, including inlets, when the total upstream area tributary to the point of consideration is less than 200 acres. The internal system analysis utilized the Rational Method to produce the 10-year frequency peak flow rates throughout the watershed. Rainfall was determined from an existing intensity-duration-frequency table. The runoff process is defined by the rainfall rate and a number of other factors including infiltration rate, percent impervious and slope of the land. All of these factors are site specific and can vary from sub-area to sub-area.
The XP-SWMM (StormWater Management Model) software
(Version 9.5) was chosen as the primary tool for evaluation of the drainage
system internal to
The modeling software is modular which allows the user to choose the packages to be used for a particular model that has been created. For the watershed event simulation, the Runoff Block and Transport Block are used. The intensity-duration-frequency table, along with the characteristics of each sub-area, is used to calculate the individual runoff quantities. In the routing method of the Runoff Block, the Rational Formula applies a simplified timing technique based on the time of concentration for each sub-watershed to produce the complete hydrograph.
The Transport Block uses the results of the Runoff Block to route the hydrographs through the drainage system. The system hydraulics is defined within this module, which is used to identify system deficiencies. The hydraulic layer uses a dynamic wave routing system with a variable time step for the system.
1. Hydrologic Parameters
A
rainfall intensity table for Douglas
The
infiltration rate is a function of the moisture contained in the soil and the
soil type. If a soil is saturated from recent rains, the amount of
infiltration will be low as compared to a dry soil. The soil type also
affects infiltration rates because certain soils will pass water more readily
than others. In the
The type of land use is one of the most important factors controlling the amount of runoff from a watershed. The internal drainage analysis concentrated on the ultimate build-out condition in order to assess adequacy of infrastructure components. Refer to Section III of this report for details on the development of the Build-Out Scenario Map. The map provides land use categories which were related to Rational Method runoff coefficients through the use of various sources. The sources include:
- Land use assumptions in this report
- Horizon 2020
- TR-55 (Urban Hydrology for Small Watersheds from
the Natural Resources
- APWA 5602.2
The
runoff coefficient, “
Land Use Hydrologic Parameters

The link between GIS and the XP-SWMM model made it possible to enter many of the parameters into the model directly from the database and mapping. After a significant effort to compile a complete, consistent map and database for the internal system, the GIS environment was used to delineate the sub-areas and develop time of concentrations. The downstream boundary of each sub-area was either at an inlet (or a manhole receiving flow from inlets) for the enclosed system, or a structure or confluence with a tributary for the open channel system. The delineated size of each area could be calculated from the polygons created during delineation. The length and slope parameters of overland flow and concentrated flow were determined in ArcView for use in a spreadsheet application.
The
calculated time of concentration, T
A
composite “
The following hydrologic parameters were ultimately imported to the XP-SWMM modeling software:
- Drainage Area
- Runoff coefficient
- Time of concentration
2. Hydraulic Parameters
The
existing drainage system components required physical characteristics such as
conduit or channel size, conduit or channel length, and roughness. In
addition, flowlines were needed for channels, pipes,
manholes, and junction boxes. Most of this data was acquired from survey
or existing
Before
transferring the database information to the hydrologic model, it was necessary
to create the system in a spatially correct manner.
Pipe
and channel roughness values (Manning’s “n”) were determined using APWA 5600
and the Lawrence Stormwater Management Design
|
|
Manning’s “n” |
|
|
0.013 |
|
Reinforced |
0.013 |
|
|
0.024 |
|
|
0.013 |
|
Grass |
0.05 |
The following hydraulic parameters were ultimately imported to the XP-SWMM modeling software:
- Manhole, inlet, and junction box flowlines
Link to: Stormwater Management Design Criteria: Rainfall Intensity Table
Section VI: Watershed Analysis
A. Overview
The
North Lawrence Drainage Area is comprised of approximately 9100 acres (14
square miles), 7.9 square miles of which drain into the
B. Recommendations
There
were three main goals of the improvement alternatives: To reduce the
demand on the
The
recommended alternative is to block the flow from north of 24/40 Highway and
pump it over the levee at a point just east of the 24/40 intersection.
This will accomplish two things. It will reduce the demand on the
The
recommendation for future development in the watershed is to maintain the
current conveyance levels in the 100-year floodplain. This will mean
allowing no development in these areas that would reduce the capacity for
floodplain storage, and may require the purchase of small parcels of land to
set aside exclusively for ponding. Methods of
mitigation for blockage of or fill in the floodplain are impractical or of
questionable value. Due to the flat topography and the lack of a proper
conveyance path that extends all the way to the outlet at Mud
As
the area develops, it will become necessary to provide emergency services to
the homes and businesses that populate the area. This will require the
improvement of the major roads in the area and significant improvement of the
hydraulic structures which carry flow under the roads.
In
an effort to quantify the various issues confronting
1. General Project Information
Rainfall runoff, overland flow, and channel flow processes for the North
Lawrence Drainage Study were simulated using the HE
2. Data and Model Development
Data and model development includes the process to determine the shape, size, sub-area break down, and hydraulic conveyance of the entire watershed. The data sources used were:
·
2-foot contour map provided by the
· USGS contour map of the area
· Field surveys
Best professional engineering judgment in conjunction with industry-accepted practices was used in interpreting the data sources. From the above sources, data was collected and the input information for the hydrologic model was created. The watershed characteristics found using the maps are bulleted below
- Sub-area boundaries
- Sub-area flow paths and slopes
3. Input Parameter Development
Input Parameter development includes the collection and subsequent input of
watershed characteristics into the HE
- Sub-area size (square miles)
- Lag time (Tlag) – is a
characteristic of the watershed, which is defined as equal to the time
from the center of mass of the excess rainfall to the time of the
peak. The HE
- 8 point representative channel cross section for
the computation of Muskingum-
Sub-area Size
Sub-area boundaries were determined using contour maps, but sub-area size was measured with ArcView GIS software. The average sub-area size was approximately 150 acres. The acreage of each sub-area was dependent upon its proximity to the location of confluences and structures.
C urve Number
The Build-Out Scenario Map was assigned

Lag Time
Lag
times for the watersheds were found using the relationship Tlag
= 0.6*Tc, where Tc
is the time of concentration. The time of concentration was found using the
Stormwater Management
8-point Representative C hannel C ross Section
The Muskingum-
4. Naming C onventions
First order tributaries are streams that flow directly into the Kansas River, second order tributaries flow into first order tributaries, third order tributaries flow into second order tributaries and so on. One first order tributary and two second order tributaries were named on the current FEMA FIRM maps. These names were retained in the naming scheme for the hydrology and hydraulic models.
The
HE
Name Identifier
In
order to represent the location of each sub-area relative to its location on
the stream network, one character was used for each tributary (first through
fourth) downstream of the sub-area being named. Along each stream, the
sub-areas were then numbered (1, 2, 3, etc.) starting from the upstream end and
proceeding downstream. Specific details about the HE
First Order Tributary
There
is one first order tributary located in the study area. The tributary
name is listed below with the single character identifier used in the HE
M
Second Order Tributaries
The
four second order tributaries were named in one of two ways. Two of the
second order tributaries have names on the current FEMA FIRM maps, Maple Grove
East Fork and Maple Grove West Fork. In these instances either
"E" or "W" was used as a second order identifier. The
remaining tributaries were then named alphabetically (a, b) starting from the
downstream end of the first order tributary they flow into. In the HE
ME
MW
Ma,
Mb Tributaries
Modeling Descriptor
The
last digit in the HE
Modeling Descriptor Key
|
Descriptor |
Hydrograph |
Remarks |
|
A |
Drainage Area |
Hydrograph calculated from sub-area characteristics and precipitation inputs. |
|
R |
Routing |
Hydrograph routing through channels. |
|
L |
Local |
Points where hydrographs along a single stream are combined. |
|
T |
Tributary |
Points where tributary hydrographs are combined together to get total flow at a junction. |
In the HE
MW_1A Drainage area routine for Basin “1” of Maple Grove West Fork to Maple Grove Drainage
ME_7L
M_7T
Mb_3R
5. Hydrologic Methodology
For the North Lawrence Drainage Study, a 24-hour Type II design storm was
utilized. The rainfall depths for the storm event were obtained from the
Rainfall Frequency Atlas of the
Rainfall Depths (inches) For a Type II 24-hour Duration Storm
|
Duration |
Return Period |
|||||
|
2 yr |
5 yr |
10 yr |
25 yr |
50 yr |
100 yr |
|
|
24 hr |
3.49 |
4.59 |
5.31 |
6.15 |
6.88 |
7.7 |
The
North Lawrence Drainage study required storage routing behind Highway 24 at the
East and West Fork confluence and at the downstream end of
The
6.
Model
The new HE
Previous Flows versus Restudy Flows (cfs)
|
|
FEMA Study/North |
|||||
|
|
2 yr |
5 yr |
10 yr |
25 yr |
50 yr |
100 yr |
|
|
|
|
|
|
|
|
|
At |
450 |
774 |
2190/1160 |
1548 |
3730/1893 |
4490/2348 |
|
1,400 feet upstream of Interstate 70 |
344 |
526 |
1450/741 |
947 |
2470/1126 |
2960/1337 |
|
At |
428 |
630 |
1280/849 |
1068 |
2180/1265 |
2610/1510 |
|
Upstream of confluence with Maple Grove Trib. |
323 |
498 |
1030/723 |
935 |
1750/1118 |
2100/1315 |
|
|
|
|
|
|
|
|
|
Below |
256 |
362 |
559/496 |
633 |
952/745 |
1140/879 |
|
Downstream of |
201 |
294 |
292/406 |
515 |
497/602 |
592/707 |
|
|
|
|
|
|
|
|
|
Below |
406 |
632 |
559/894 |
1154 |
952/1365 |
1140/1631 |
The difference between the flows from the two sources is the methodology used to calculate them. This study calculates flows based on the unusual characteristics specific to the North Lawrence Drainage Area. The FEMA Study uses equations developed by regression analysis using general characteristics common to streams of all sizes from across the entire region.
Link to diagram: Watershed Analysis: HEC-1
D. HE
1. General Project Information
The
HE
2. Data Sources
Data and model development includes the process to determine the primary stream network, cross section geometry, flow lengths, bank stations, and Manning’s “n” values for the entire watershed. The data sources used were:
·
Planimetric information in GIS format provided by the
·
Topographic information provided by the
· Digital elevation data in the form of a triangular irregular network (TIN) generated using GIS and topographic information
·
Aerial photographs provided by the
·
Field surveys of stormwater drainage
structures and roadways provided by Landplan
Engineering of
·
Best professional engineering judgment in conjunction with industry-accepted practices was used in interpreting the data sources.
3. Input Parameter Development
From
the above sources, data was collected and the input information for the
hydraulic models was created using GeoRAS, an ArcView extension that compiles GIS data into an input file
for the HE
Primary Stream Network
The
primary stream network was developed using ArcView.
The network includes channels that are fed by a drainage area of 240 acres or
more. Small “stubs” or tributaries that are not long enough to place
three or more cross sections along the stream were removed from the HE
Naming C onvention
Four
separate streams were modeled in HE
First Order Tributary
There is one first order tributary located in the study area. The tributary name is listed below with the identifier used in the hydraulic model
Second Order Tributaries
There are four second order tributaries in the study area. Maple Grove West Fork was combined with Maple Grove Drainage and the remaining three tributary names are listed below along with the identifier used in the hydraulic Model
MG
East
Trib A
Tributary A to
Trib
B
Tributary B to
C ross-Section
Development
A
cross section shape-file was created using ArcView.
Flowpath Lengths
A
flowpath lengths shape-file was created for use in
the GeoRAS export. The flowpaths
follow the stream centerline at a distance to the right or left where
approximately two-thirds of the water in the floodplain is contained. GeoRAS used this coverage to create left and right overbank reach lengths. GeoRAS
used this file to create the geometry export file for HE
Manning’s “n” Values
Manning’s
“n” values were determined using field observations, aerial photographs, and
engineering judgment. The values were entered directly into the HE
Overbank Manning’s “n” Values
|
Groundcover condition |
Manning’s “n” |
|
Trees |
0.10 |
|
Moderately treed |
0.08 |
|
|
0.04 |
|
Natural |
0.045 |
The Manning’s “n” values for
the channels in the North Lawrence Drainage study follow the trends
shown. Some values may be slightly different in the HE
Structure Manning’s “n” Values
|
Structure Material |
Manning’s “n” |
|
|
0.013 |
|
|
0.021 |
|
Steel |
0.013 |
Manning’s “n” values of
structures were mainly determined by field observations. The guideline
tables in the HE
Roadway C rossings
Structures
at roadway crossings were entered directly into the HE
Modeling methods and
parameters for each structure (such as
Expansion/C ontraction C oefficients
Expansion and contraction coefficients were left at the
default 0.1 and 0.3, respectively, for all sections not near structures.
As the HE
Boundary C onditions
Normal depth was used to calculate the downstream boundary condition on all streams. The slope was calculated by reading elevations from the contours near the downstream end of each stream and dividing by the channel length between elevations.
Ineffective Flow Areas
Ineffective flow areas were placed near structures according
to the HE
Ineffective flow options were also used to limit flow in the floodplain on cross sections where engineering judgment deemed the flow could not extend across the entire area shown in the cross section. The locations were generally determined by contours and aerial photos as well as evaluating the model results. Obstructed areas were also used to prevent flow to specific areas. Most commonly obstructed areas are isolated low areas such as ponds.
C hannel Bank
Stations
4. Results
The water surface elevations were very similar to the published FEMA values, despite the significantly lower discharges. This can be explained by the extremely wide flat floodplain with very little to no slope. Also, the significantly undersized culverts remain unchanged and are a controlling factor in the water surface elevation. Differences of one foot or more are listed below.
E. Alternatives for Future Development
Several alternatives were investigated to alleviate flooding problems in the
The External System was modeled as one main reach, extending from the Mud
While the details of the modeling are discussed in previous sections of this
report, there are a few key features pertinent to the alternatives discussed
here that should be reiterated. This entire area is very flat, which
results in significant ponding until enough hydraulic
head can develop to push the water downstream. When the water does begin
to flow, it has relatively low velocities. There are major hydraulic
constrictions near the Mud
1. Flood Reduction Alternatives
As
stated earlier, the cornerstone to the recommendations in this report is greatly
reducing the burden on the
A
diversion channel was modeled along 24/40 Highway, from near the 24/40
intersection, east to connect with Tributary A near
Another
method of dealing with the excess water from the northwest areas is to pump it
over the levee. The culverts at the 24/40 intersection and the Maple
Grove East culvert would be removed and the new east-west culvert under 24
Highway would still be required, as in the diversion option described above.
A large area north of 1800 Road and east of 24 Highway would become a pumping
reservoir, ponding to an elevation of approximately
822 feet for the 10-year and approximately 825 feet for the 100-year. It
should be noted that the elevation at the intersection of 24 and 40 Highways is
approximately 822 feet. To contain the 100-year event, would require
raising 24/40 for approximately 2000 feet east of the railroad and 24 highway
for approximately 1000 feet north of the intersection, at a cost of approximately
$800,000. This ponding area could be reduced by
building berms to protect certain areas and/or
increasing pumping capacity to compensate for the loss of storage.
Another alternative would be to build two pump stations. One at the
current site would function in a reduced capacity, while another east of 24/40
Highway would pump the water from Maple Grove East directly over the
levee. This would require a berm to capture the
water and would probably be more expensive overall, but could be justified if
property costs and location dictate the design. The cost for the pumps
and controls to handle the 10-year flow, approximately 800 cfs,
would be approximately $1.7 million. To pump the 100-year discharge, the
cost would increase to approximately $3.0 million. Total costs for
pumping stations are highly variable, and depend on the level of redundancy
desired with regard to backup pumps, power supplies, outlet works, etc. and
ancillary components such as pump houses and inlet and outlet works.
Depending on the desired capacity and configuration, the total cost for the
station could exceed $10 million. Pump costs for this scenario are
independent of the
An
investigation was performed to evacuate flood water from the basin during times
of high flow on the
Of
these alternatives, cutting off the flow from the
2. Future Hydraulic Drainage Improvements
As
the area develops, the need for uninterrupted transportation and emergency
services will increase. An investigation was undertaken to assess the
requirements for raising the major roads above the 100-year elevation and
building hydraulic structures that would pass the 100-year with out increasing
the backwater. A summary of the improvements and associated costs can be
found in the tables at the end of this section. In the
There has been some development in this area already and questions have arisen regarding the effects of fill placed in the floodplain. A study was conducted to assess the effects and determine a general mitigation strategy for future development. In a test reach, a large area was blocked off in the 100-year floodplain to simulate development that might place fill in the area to elevate the property above the 100-year flood elevation. While this does not have a large effect on the flood profiles, due to the basin factors already discussed, the cumulative effect of large scale development will have a detrimental affect on the flood elevations upstream. Also a concern is the reduction in routing storage. One advantage to the low hydraulic gradient and low velocities in this system is a significant attenuation of flood peaks as they move through the basin. If the flow is constricted, it will reduce this phenomenon, resulting in increased peak flows. The investigation revealed that restoration of at least 70% of the flow area lost to fill, through overbank benching, would be required to mitigate the increase in flood elevations. However, this would reduce the routing storage and would require regular maintenance and large scale planning and coordination to achieve the desired affect. While these measures could theoretically maintain the 100-year flood elevations in the basin, this methodology is not deemed practical as a watershed planning program.
3. Summary
Several
alternatives were investigated in the North Lawrence Drainage Basin to reduce
flood elevations, lessen impacts on “Internal” facilities, provide drainage in
the event of high flows on the
The
recommended improvements begin with cutting off the flow from north of 24/40
Highway. This is necessary to reduce the burden on the
Future development in the project area will result in a need for improved roadways. The mile-section roads were modeled as being raised up out of the floodplain and fitted with hydraulic structures that resulted in no backwater. As the area develops, it will be necessary to keep the floodplain available for storage. Therefore no development should be allowed that reduces the capacity of the floodplain to attenuate the flood peaks.
While
there are many options for improving the flooding issues in the North Lawrence
Drainage Basin, the nature of the drainage area make some solutions more
practical than others. This area lacks a well defined channel, at a
consistent gradient for a significant portion of its length.
Additionally, there are some significant impediments to conveyance throughout
the reach, especially in the lower portion near Mud
Link to diagram: Watershed Analysis Alternatives
Link to diagram: Watershed Analysis HEC-RAS
Link to
diagram: Maple Grove Cut-off
Alternatives
Section VII:
A. Purpose
The effective FEMA hydraulic model was revised to approximate the amount of
flooding that would occur in the
B. Results
To determine the “most likely” breach location
the model was run with peak flows in excess of the 100-year storm to determine
the first place of overtopping. This was located in the northwest portion
of the study area, with a flow of approximately 375,000 cfs.
By comparison, the 100-year and 500-year flows are 240,000 cfs
and 347,000 cfs, respectively. A breach
location was also assumed downstream of the
The
1. General Project Information
The
HE
2. Data Sources
Data and model development includes the process to determine the primary stream network, cross section geometry, flow lengths, bank stations, and Manning’s “n” values for the entire watershed. The data sources used were:
·
Planimetric information in GIS format provided by the
·
Topographic information provided by the
· Digital elevation data in the form of a triangular irregular format (TIN) generated using GIS and topographic information
·
Aerial photographs provided by the
·
Best professional engineering judgment in conjunction with industry-accepted practices was used in interpreting the data sources.
3. Input Parameter Development
From
the above sources, data was collected and the input information for the
hydraulic models was created using GeoRAS, an ArcView extension that compiles GIS data into an input file
for the HE
Naming C onvention
Only
one reach was modeled. The
C ross-Section Development
The
existing HE
To
model the breach failure condition the cross sections were extended to the
northeast to the Mud
Flowpath Lengths
A
flowpath lengths shape-file was created for use in
the GeoRAS export. The flowpaths
follow the stream centerline at a distance to the right or left where
approximately two-thirds of the water in the floodplain is contained. GeoRAS used this coverage to create left and right overbank reach lengths. GeoRAS
used this file to create the geometry export file for HE
Manning’s “n” values
Manning’s
n values for the
Roadway C rossings
Structures
at roadway crossing were imported from the HE
Expansion/C ontraction C oefficients
Expansion and contraction coefficients were left at the
default 0.1 and 0.3, respectively, for all sections not near structures.
As the HE
Boundary C onditions
Known water surface elevations from the original HE
Ineffective Flow Areas
Ineffective flow areas were placed near structures according
to the HE
Ineffective flow options were also used to limit flow in the floodplain on cross sections where engineering judgment deemed the flow could not extend across the entire area shown in the cross section. The locations were generally determined by contours and aerial photos as well as evaluating the model results. Obstructed areas were also used to prevent flow to specific areas. Most commonly obstructed areas are isolated low areas such as ponds.
C hannel Bank Stations
Link to diagram: Watershed Analysis Kansas River Inundation