Analysis of Joe King's Tall-Tower Wind Speed Data over 12 Months
plus
Healthier Alternative to Coal
and
Greater Stimulus to Kansas Economy
Raymond H. Dean, Professor Emeritus EECS, University of Kansas
5 November, 2006
Coal-burning proponents often assert that it is not feasible to generate electric power with more than a small percentage of alternative sources like wind and solar. They say that wind, for example, will always be a minor player, because it is too "variable." To quantify the variability of Kansas wind, I have analyzed the recent wind measurements made by Joe King of Coriolis for the Kansas Corporation Commission. The results of this analysis are based on data taken at 10-minute intervals by instruments mounted 80 meters above the earth on KDOT tall-towers in Ellsworth, Jewell, Kearny, Logan, Ness, and Sumner Counties in Kansas. Measurements were taken over a period of two years, and I selected the 12 different months during this period which have the highest percentage of valid data – where instruments were working correctly. This provided 310,194 valid data points for analysis.
The observed average wind speed was surprisingly similar in all six counties, and there is remarkably little variation from one month to another. The following figure shows the average measured wind speed in each of the 12 months indicated. Each of these 12 monthly averages includes all that month's data at 80 m height at all 6 measuring stations.
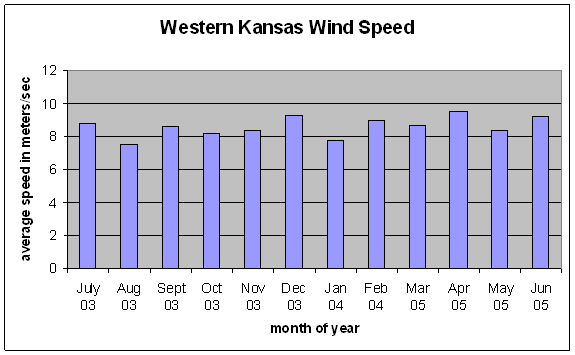
These average speeds are high enough to make wind power economically competitive. As you can see, there is some variation from month to month, but this variation is relatively small (smaller than typical customer load variations), and the wind does not regularly "die" in the summer. There is, of course, a substantial amount of rapid variation in individual measurements, but it's reasonable to expect such variation to become relatively smaller as more and more separated measurements are accumulated. The simultaneous measurements at the six Kansas sites confirm this expected effect.
Moving weather fronts produce relatively slow variations over periods of 7 to 10 days that are partially correlated within regions of up to about 200 miles in width. The measurements at the 6 Kansas sites show these correlations. However, north-south high-voltage transmission lines now being considered for construction in Western Kansas (separately from the proposed Holcomb project) should substantially improve our interconnection with other windy states to the north and south of Kansas. This enlarged area will eventually provide substantial canceling of slowly varying wind patterns.
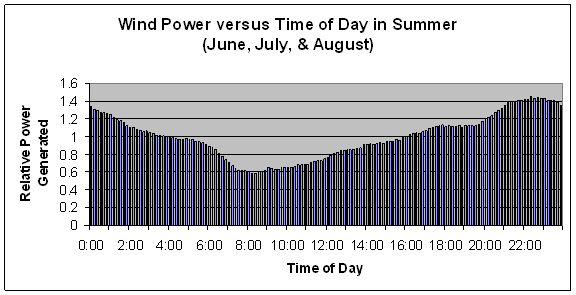
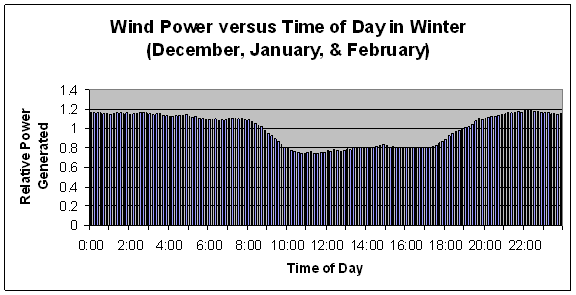
That leaves diurnal or daily variation, and to see that I did the following: I limited each wind speed datum to 1.5 times its average value to simulate wind turbines configured for an average capacity factor of 0.39. I cubed each speed to obtain a number proportional to electrical output power. I scaled each site's power so that all 6 sites would have equal weight and then combined the 6 sites' scaled powers in each 10-minute interval. Then for each 10-minute interval in a 24-hour day, I averaged over the 366 days in the twelve selected months. The figure below shows the results.
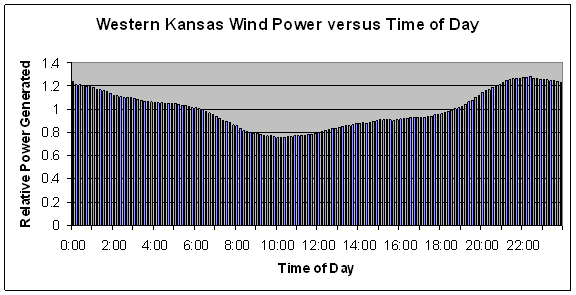
This is the residual variation that cannot be averaged away with disbursed location. The available wind power peaks at night.[1] Coal proponents will say – "look, the wind varies!" Yes, but this residual variation is no more than typical customer loads vary in the course of a day. They will also say – "and look, the peak wind power is at the wrong time of day." Yes, as things currently stand, if we were to produce 100% of our "base power" from wind (no coal and no nuclear), we might need to double the capacity of our relatively inexpensive peaking equipment to handle the combination of variable customer load and variable wind.[2] Suppose, however, that over the next three decades our nation switches to plug-in hybrid cars to reduce our dependence on foreign oil. The charging of these electric vehicles would shift the electrical load peak to nighttime. Then wind base power would need less peaking equipment than coal or nuclear base power would need. Wind power nicely matches a national policy of energy independence.
Eventually, coal and nuclear fuels will run out. Then we'll be forced to get all our electricity from renewable sources like wind. To deal with variations of all kinds, we'll be forced to create whatever stored energy we might need, and the extra step of creating stored energy will have an extra cost that current economic calculations do not recognize. In the meantime, however, we can use natural gas to smooth the transition. Joe King's tall-tower data enable us to quantify various scenarios. For example, suppose we wanted to produce a fixed amount of firm power – the same amount of firm power the proposed new pulverized-coal plants at Holcomb would produce.
For 1950 MW of firm electrical power, we could install 5000 MW name-plate capacity of wind turbines in (for example) two 5-mile x 60-mile corridors running east from the Colorado border, perhaps along highway 70 and highway 50. Transmission lines running down the centers of each of these two corridors would gather the generated power. The total length of these two transmission lines would be approximately the same as the total length of the two new transmission lines being proposed to carry power from Holcomb to the Colorado border, so this wind system would not need any more transmission lines than the proposed pulverized-coal plants would need. To handle the wind's variation, we could use gas-fired turbines and/or combined cycles with a total capacity of 975 MW.
The data from Joe King's 6 sites say that over the course of a typical 12-month year, the wind turbines would provide approximately 71% of the average power (1400 MW average), and the gas-fired turbines would provide approximately 22% of the average power (420 MW average), and spot purchases would handle the remaining 7%.[3] Thus, we could generate the proposed amount of firm power with no coal at all, using technology that is completely available now. Based on an actual 10 permanent jobs per 100 wind turbines at the new wind farm near Beaumont, Kansas, the number of new permanent jobs created would be about 360 for the wind turbines, plus additional jobs to manage the gas turbines. This is substantially more than the 140-150 new jobs the pulverized-coal plants would create.
Professor Ralph Gamble's study (The Economic Impact of Building and Operating Three 650 MW Coal-Based Power Plants in Finney County Kansas, December 2005) indicates that the 140-150 new permanent jobs at the plant would "induce" additional 340-350 new permanent jobs somewhere in Kansas. This corresponds to a "total economic multiplier" of about 3.4. He says that about 54% of all the new permanent jobs created and induced by the proposed pulverized-coal project would be in Kansas. He says the project would ultimately create and induce about 3,670 temporary jobs somewhere in Kansas, but this would be only about 17% of all the temporary jobs created and induced.
A similar analysis for the wind-and-gas project would reveal a much larger economic stimulus. Applying the same 3.4 multiplier to about 400 new permanent jobs for the wind-and-gas system yields about 1360 new permanent jobs created and induced somewhere in Kansas. When compared to Professor Gamble's 500 new permanent jobs, that's 2.8 times more new permanent Kansas jobs from wind than from coal.
In Technical Report NREL/TP-500-37720, May 2006, S. Tegan compares super-critical pulverized coal plants using PRB coal with 0.35-capacity-factor wind turbines in Colorado. This is approximately the same equipment comparison, and Colorado is not far from Holcomb, Kansas. He concludes that there would be 2.6 times more direct O&M expenditure for wind than for pulverized-coal. He also finds that of all the money spent on the production of electricity from pulverized coal over 20 years, only about 9% would remain in-state, whereas of all the money spent on wind-powered electricity, about 39% would remain in-state. Dividing 0.39 by 0.09 gives 4.33. This says that more than four times more of the project's initial and on-going expenditures stay in-state with wind than with pulverized coal.
Another economic question is: Which technology has the lowest total cost for the benefit provided? Over 20 years, Tegan finds that the total direct cost of electricity from wind would be about 24% higher than the total direct cost of electricity from pulverized coal. If we completely ignored all other economic factors, wind would lose. But if we include the cost of a full carbon tax or the carbon capture and storage required to avoid it, coal would lose.
Coal's disadvantage increases when we include the risk of an increase in the cost of the imported petroleum required to extract and transport coal. Coal's disadvantage increases further when we include the cost of the environmental degradation produced by mining operations. Coal's disadvantage increases still further when we include the public and private health costs associated with the air pollution it creates.
The total fossil combustion in the alternative wind-and-gas system would be only about 24% as much[4] as the total fossil combustion in the proposed pulverized coal system. Moreover, the alternative system would use gas instead of coal - with correspondingly less sulfur, mercury, and small-particulate pollution. Finally, since natural-gas combustion creates only 56% as much carbon dioxide as coal combustion, the carbon dioxide released by the wind-and-gas system would be only about 0.56 * 0.24 => 13% as much as that released by the proposed pulverized-coal plants. The wind-and-gas system would produce far less global warming.
Thus, compared to an alternative wind-and-gas system, pulverized coal has many additional costs:
· Cost of CO2 capture and storage needed to avoid global warming or a carbon tax.
· Potentially higher cost of petroleum needed to extract and transport coal.
· Cost of residual environmental degradation produced by coal mining.
· Degradation in public and private health produced by residual air pollution.
At the present time, we are effectively subsidizing coal by allowing all these costs to be passed on to the public with no financial recognition. Many of these costs are hard to estimate, and coal advocates use this as an excuse to omit them from consideration. This practice is not reasonable, because it introduces a systematic coal-oriented bias in all financial calculations. Instead of using ignorance as a justification for bias, the proper thing to do is to make a best estimate of all uncertain costs, and use that expected value and an associated risk premium in financial planning.
Instead of "fast-tracking" this pulverized coal proposal, we should be slowing it down to make time for evaluation of these other costs. Without this additional study, we cannot know precisely how much these other costs will be, but existing information suggests that the following estimates are probably conservative:
Western Kansas wind power cost ......................................... ≈ 3.5 cents / kWh
Western Kansas coal power:
direct cost ≈ 2.8 cents / kWh
CO2 capture and storage[5] ≈ 1.1 cents / kWh
increase in cost of coal[6] ≈ 0.7 cents / kWh
environmental & health[7] ≈ 1.0 cents / kWh
total coal power cost ..................................... ≈ 5.6 cents / kWh
Thus, it's reasonable to expect that the actual total cost of coal-produced electricity will turn out to be at least twice the currently recognized cost.
For political decisions, we need to consider both local economic stimulus and total benefit relative to total cost. The product of these two criteria is:
local wind stimulus total wind benefit/cost
Relative value = ----------------------- x ---------------------------
local coal stimulus total coal benefit/cost
Now, let's substitute the average of the previously cited local economic stimulus ratios, (2.8 + 4.33) / 2 ≈ 3.5, and the reciprocal of the previously estimated relative total costs, 5.6 / 3.5 = 1.6. This gives:
Relative value ≈ 3.5 x 1.6 ≈ 5.6
This says that if we consider local economic stimulus and total cost together, wind is more than five times better than coal.
Appendix
Summer and Winter Daily Variations in Western Kansas Wind Power