City of Lawrence
2005 Recycling
Annual Report
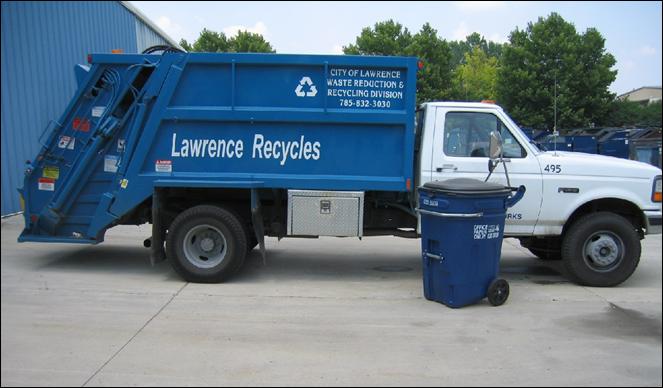
Office waste paper recycling services are
available through the City’s Solid Waste Division
Solid
Waste Division
Waste
Reduction and Recycling
ANNUAL RECYCLING REPORT FOR 2005
EXECUTIVE SUMMARY
This report summarizes the materials, quantities,
associated revenue, and avoided landfill costs derived from diverting recycled
materials from the landfill for 2005.
Numeric quantities of materials diverted for recycling by the City of Lawrence Solid Waste Division
and other recycling entities are in the attached tables.
In 2005, the
City’s Solid Waste Division collected an estimated 69,777 tons of municipal solid waste. Of this total, 14,836 tons of material was recycled by the City and 54,941 tons were landfilled.
An additional estimated 12,637 tons of material were recycled by the private sector, primarily
through the Wal-Mart
Community Recycling Center (1,566
tons), University of Kansas (521 tons), 12th & Haskell Bargain
Center (275 tons), Lonnie’s Recycling (75 tons), and by large retail, industrial and warehouse facilities and other smaller recycling operations (9,200 tons).
Also included in the recycling rate is an estimated 1,000 tons due to backyard composting and
grasscycling. (Note: The Solid Waste Division also landfilled an
estimated
16,280 tons of construction/demolition
waste in 2005. Construction/demolition
waste is not included in municipal solid waste data.)
TOTAL WASTE DIVERTED FROM LANDFILL
BY THE CITY
A total of 14,836 tons of grass clippings and leaves,
newspaper, cardboard, brushy wood waste, Christmas trees, white goods and
metals, and office waste paper were recycled through City programs in 2005 for
a savings in landfill costs of $284,032.83. Revenue from the sale of recycled materials
was $182,004.94. The private sector recycling efforts which diverted
12,637 tons of materials from disposal saved the City an additional $241,998.55
in landfill costs.
TOTAL WASTE
DIVERTED FROM LANDFILL BY THE CITY AND
PRIVATE SECTORS
In
2005, more than 27,473
tons of materials were recycled through City and private sector efforts in Lawrence representing a 33 percent recycling rate, which is
believed to be the highest in Kansas
and is higher than the national average (last listed by EPA as 30.4 percent).
This high rate of 33
percent was achieved even though the Wal-Mart
Community Recycling
Center was closed for
approximately six months for reconstruction.
Although there was some loss of recycled tonnage (1,566 tons less
collected by Wal-Mart than in 2004) in 2005 due to this closure, the recycling
rate only lost one percentage point. The
new larger and more accessible center reopened near the end of 2005.
The table on the
following page presents Lawrence’s
historical recycling rate and the tons of waste disposed and recycled per
person from 1995 through 2005.
MATERIALS RECOVERED THROUGH
CITY PROGRAMS
Grass Clippings/Leaves
The City of Lawrence’s Solid Waste Division provides separate citywide
collection services for grass clippings and leaves from Lawrence residences on Mondays from
approximately March until near Christmas.
These materials are trucked to the City’s composting facility. The Streets Division also contributed clean
street sweeping to the Compost Facility for composting. In 2005, 10,929 tons of grass clippings and
leaves were collected and composted resulting
in a savings of $209,290.35 in avoided disposal costs.
Beginning in 2005, by
Ordinance, only cans, carts and compostable kraft paper bags could be used for
yard trimmings for curbside collection.
Plastic bags were no longer allowed for the containerization of yard waste. The new policy for yard waste containers: (a)
increase collection efficiency by reducing collection time; (b) improve worker
safety by eliminating the need to cut open plastic bags with box cutters; and
(c) yield higher quality compost by reducing plastic contamination.
Compliance with the
yard waste container policy has been fantastic in 2005 and is currently above
99 percent of homes which set out yard waste.
OLD NEWSPAPERS
Nine city-sponsored drop boxes for newspaper
recycling are located throughout Lawrence. In 2005, 1,038 tons were collected and
recycled, representing a 26% increase in material collected from last year, due
primarily to the temporary closure of the WalMart Community Recycling
Center. Diverting these materials from the landfill resulted in savings of $19,877.70 in avoided disposal
costs. Market values steadily decreased
throughout the year - from $95 per ton down to $75 per ton over the course of
the year for baled material. This drop
in fibers market prices was partially
blamed on plant closures and Hurricane Katrina.
The
sales of old newspapers provided revenue of $88,179.33.
Old Corrugated Containers
The
City’s Solid Waste Division serves over 530 Lawrence businesses with cardboard recycling
services in addition to providing seven public drop boxes for corrugated
cardboard – an increase of 3 locations.
In 2005, 920 tons of materials were collected for recycling resulting in revenue of $77,205.88 and an avoided disposal cost
of $17,618.00. Price per baled ton of corrugated cardboard dropped
from $95 to $65
per baled ton over the course of the year.
SORTED Office WASTE Paper
Collecting from small businesses and some schools,
this program diverted 29 tons of paper from the landfill. Market values decreased throughout the year (from
$100 per ton to $75 per ton) for baled, sorted office waste paper. Revenue derived from the sale of the paper
was $2,375.20, and avoided landfill costs were $ 555.38.
OLD MAGAZINES
Generated by city offices, less than 1 ton of
material was shipped loose in gaylord boxes to V.I.M Recyclers in Topeka. Revenue received for unbaled old magazines
was $ 4.00.
BRUSHY WOOD WASTE
In 2005, the City’s Parks and Recreation Department
diverted 1,729 tons of brushy wood waste from the landfill. Two programs administered by the Parks
Division contributed to this diversion; (a) a residential drop-off chipping
service at the Wood Recovery and Composting Facility (1,223 tons); and (b)
Right of Way removal of tree and brush debris (506 tons). Wood chips produced through these programs
were used on city landscape projects and made available to the community
through the Parks Division Wood Chip sales.
Avoided disposal costs attributed to the brushy waste programs was $33,110.35. Revenue
generated from the sale of wood chips was $ 8,128.00.
Christmas Trees
Following Christmas, three collection days were
scheduled whereby the Solid Waste Division crews collected Christmas trees curbside
for recycling from Lawrence
residents. Twenty six tons - or 2,088
individual Christmas trees - were collected, processed and used as erosion control
and wildlife habitat enhancement at the closed landfill north of Riverfront Park.
Diverting Christmas trees from the landfill provided $497.90 in avoided disposal costs.
White Goods & Metals
Bulky item pickup for appliances like refrigerators,
washers and dryers is provided by appointment by the City’s Solid Waste
Division to Lawrence
residents. Metal appliances and other
collected metals are sold to a local metal recycler. One hundred and sixty one (161) tons were
recovered and sold for revenue of $6,112.53 and provided an avoided
disposal cost of $ 3,083.15.
Used Motor Oil
A total of 6,028 gallons of used oil was collected
at the City’s Maintenance Garage in 2005 of which 3,810 gallons were recycled
as bunker fuel by Clearwater Recycling. Two thousand, two hundred and eighteen (2,218)
gallons were burned for heat at the garage.
The collection of used oil generates no revenue.
Tires
A total of 2,469 tires were collected for proper
disposal by the City’s Solid Waste Division.
The Solid Waste Division provides Lawrence
residents free pickup for up to five passenger tires per year, per
household. Tires were collected by
TireTown for shredding and monofill in Leavenworth County
at the cost of $ 3,178.70.
Freon
Four hundred and fifty five (455) refrigerators and
other freon-containing units were collected for recycling by the City’s Solid
Waste Division. Over seventy five pounds
(75 lbs) of Freon were captured and sent for reclamation by trained Solid Waste
Division maintenance personnel with EPA-approved equipment. Federal regulations require Freon to be
removed from appliances prior to salvaging.
By moving this responsibility in-house, the city has greater regulatory
control of the extraction process and saves money.
HOUSEHOLD HAZARDOUS WASTE
Over 161,720
pounds of hazardous waste generated by Douglas
County households and small businesses
were diverted from the Hamm
regional landfill in 2005. Two thousand
seven hundred and fifty one households used the program which included
scheduled drop off appointments, homebound pickups, and abandoned and orphan
waste collection services. Seventeen
percent of households who utilized the HHW Program lived outside the City of Lawrence – the highest
percentile recorded to date of county participation.
In 2005, the Small Quantity Generator program
provided technical assistance and environmentally-preferred disposal options to
68 small businesses.
CITY OF LAWRENCE
SOLID WASTE DIVISION
MATERIALS RECOVERED FOR
RECYCLING - 2005
|
|
|
Avoided
Landfill
|
Material
|
Quantity
|
Revenue
from Sales
|
Disposal
Costs
|
|
Grass
Clippings / Leaves
|
|
N/A
|
$ 209,290.35
|
|
|
|
|
|
|
Old
Newspaper
|
1,038
tons
|
|
$
19,877.70
|
|
|
|
|
|
|
Old
Corrugated Containers
|
920
tons
|
$ 77,205.88
|
$
17,618.00
|
|
|
|
|
|
|
Brushy
Wood Waste
|
1,729
tons
|
$
8,128.00
|
$ 33,110.35
|
|
|
|
|
|
|
Christmas Trees
|
26 tons (2,088 trees)
|
N/A
|
$ 497.90
|
|
|
|
|
|
|
White
Goods & Metals
|
161
tons
|
$ 6,112.53
|
$ 3,083.15
|
|
|
|
|
|
|
Office
Waste Paper
|
29
tons
|
$
2,375.20
|
$ 555.38
|
|
|
|
|
|
|
Old
Magazines
|
1.0
tons
|
$ 4.00
|
$ NA
|
|
|
|
|
|
TOTAL
|
14,832 TONS
|
$ 182,004.94
|
$ 284,032.83
|
Other Materials
|
|
|
|
|
|
|
|
|
|
Used
Motor Oil
|
6,028
gallons
|
|
|
|
|
|
|
|
|
Tires
|
2,469 units
|
|
|
|
|
|
|
|
|
Freon
Recovery
|
455
freon-containing units were processed
|
|
|
|
|
|
|
|
|
|
|
|
|
|
|
|